ShortCut[R]: locator
Welcome to my new category: ShortCut! Here I’ll shortly explain some smart features, unknown extensions or uncommon pathways of going for gold. Today it’s about the Gnu R tool locator.
With locator you are able to detect the mouse position inside you plot. Just run locator() and click some points, when you’re finished click the right button and locator will print the x - and y -values of the clicked positions.
With this tool it’s possible to visually validate some numerical calculation.
With a little bit more code, you can output the coordinates right into you plot:
> x<-seq (0, 10, .01)
> plot (x, dgamma (x, rnorm (1, 2, 0.5), rnorm (1, 1, 0.5)), t='l', main='any curve', ylab='y')
> text (p<-locator (1), paste (p, collapse="\\n"), adj=0)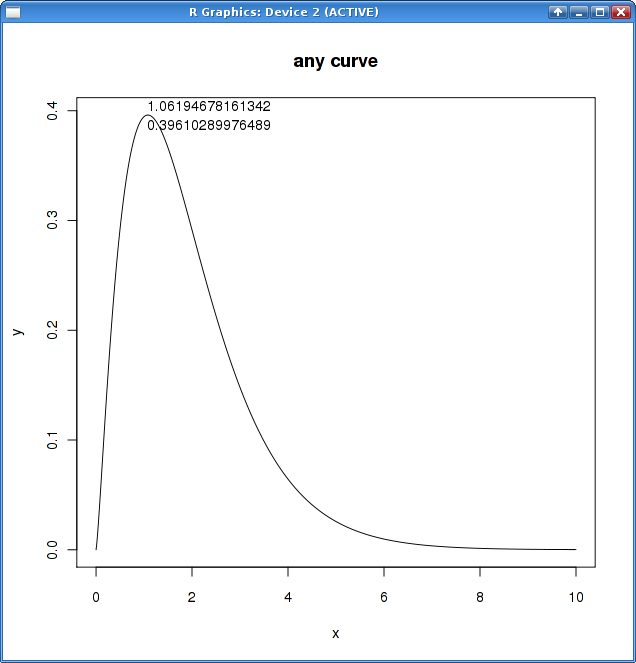
With a click into the plot you’ll be able to create a result like figure 1.

Leave a comment
There are multiple options to leave a comment: