iso2l - Usage
Usage of iso2l.
Input
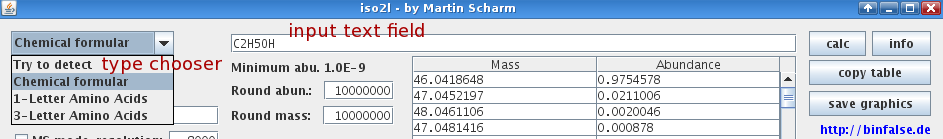
To compute an isotopic distribution of a compound type its chemical formula to the upper text field. The tool is also able to determine the elemental composition from amino acid chains. It tries to guess the type of input, if that fails you can give a hint with the chooser in the upper left corner, see figure 1.
Here are some samples for input:
C2H5OHGluGlyValAsnAspAsnGluGluGlyPhePheSerAlaArgMMAKWLLGLWLAILLVDRPG(C(H)2O)6
GUI interaction
Settings
In the upper left side of the window you’ll find the settings. Top-down and left-right you can define:
- Stretch peaks
- Scale the peaks, so that the most abundant isotope is 100%
- Display Name
- Display the components name in the upper right corner of the graphic
- Name
- Choose a name for the compound that will be displayed in the graphic. If you leave this field empty and regardless checked the box to display the name the input string will be displayed
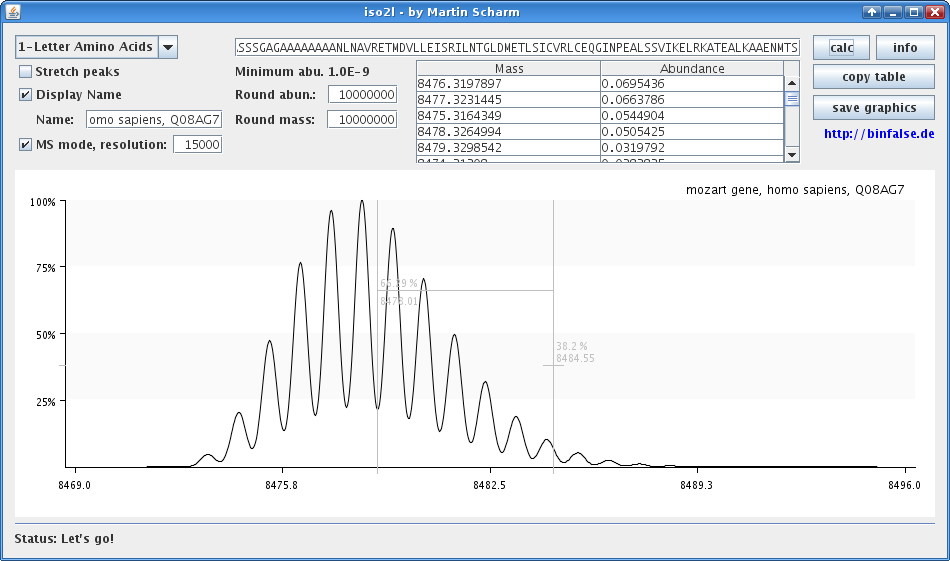
- MS mode and resolution
-
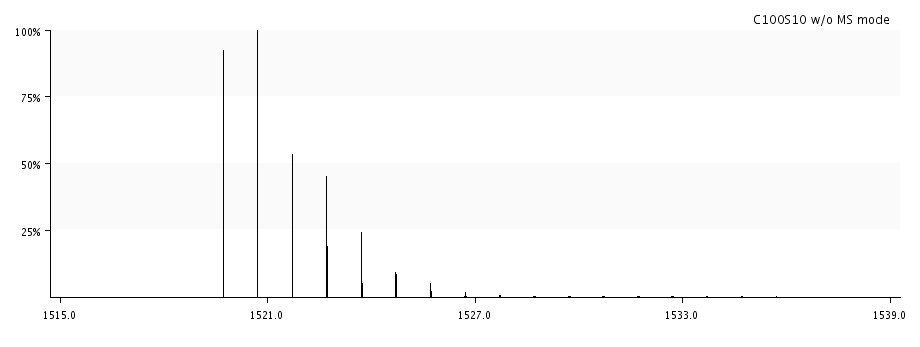
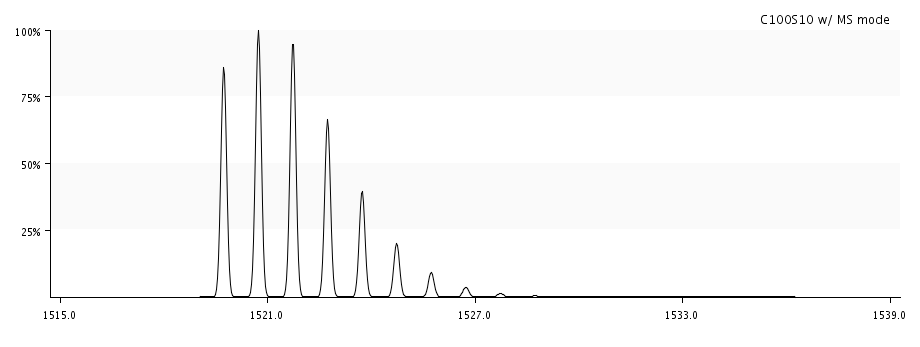
MS mode displays the isotopic pattern as expected by mass spectrometry instruments. Without this mode you'll see a theoretical graphic, each isotope gives a single peak. But MS instruments aren't able to distinguish between two peak with a mass of ±0.000001 m/z. If you enable MS mode the tool a peak is converted to a normal distribution, its variance is approximated by the resolution of the MS instrument. You can define the FWHM resolution in the text field. Compare figures 2 and 3, especially look take a look at the peak at ≈1521.7. Without MS mode this peaks is much smaller, because it contains many overlying peaks. With MS mode enabled these peak-distributions support each other.
C100S10 w/ MS mode - Minimum abu.
- Choose the minimum abundance for a peak, other peaks are filtered.
- Round abun. and mass
- Here you can decide how to round the values of a peak. The calculated values are multiplied with these values, rounded to integers and after wards divided. Assume for example a peak has a mass of 1.2345 and you choose a round value of 10, the final mass will become $$\frac{\lfloor 1.2345 \cdot 10 \rceil}{10} = 1.2.$$ A round value of 100 would result in 1.23. Its also possible to choose values <1, so a mass of 12.345 with a round value of 0.1 will result in 10.
Output
The results are displayed in form of a table and a graphic. The table contains masses and abundances of each peak. Its initially sorted by abundances, but you can resort the values by clicking the header. The graphic contains a visual feedback of the isotopic cluster. If you hover with your mouse you’ll see the abundance and mass at this point. You can zoom into a specific mass window, just right click on one border of the mass window to show and move to the other boundary before releasing the right button. Of course you can zoom into an area of this area again. Double-click to switch one zoom back, or right-click and choose Full unzoom to get back to the initial zoom level.
Export
The results can be exported with the buttons in the upper right corner. Copy table will copy the contents of the table to your clipboard so you can paste them to any editor of your choice. Save graphics will create an image of the displayed graphic, you can decide where to save it.
There are also two shortcuts for saving and copying. Ctrl+C will copy the table, while Ctrl+S will save the graphics. So you are able to save a graphic with a fade, see figure 4.

Leave a comment
There are multiple options to leave a comment: